Selected Recipes in Python
Although we have used Python for our examples, you can easily adapt these recipes to command-line scripts written in other programming languages.
Write configuration file
You have a command-line script that you want to turn into a web application. Here is an example of such a script.
from sys import argv

x, y = argv[1:]
print('{} divided by {} is {}'.format(x, y, float(x) / float(y)))
Running the script produces the following output.
$ python run.py 4 5
4 divided by 5 is 0.8
To wrap the script in a web interface, we write a configuration file.
[crosscompute]
command_template = python run.py {x} {y}
show_raw_output = True

x = 10
y = 3
Specify tool name
The configuration file must end with the extension .ini and contain a section that starts with the word crosscompute, optionally followed by the name of the tool.
[crosscompute our-simple-one-function-calculator]
If you do not specify a tool name, then the name of the tool will be the name of the folder containing the configuration file.
Specify command-line arguments
The most important option in the configuration file is the command_template, which tells CrossCompute how to run your script.
Here, we use python to execute run.py with x and y as arguments.
command_template = python run.py {x} {y}
If your command is long, you can split it across multiple lines.
command_template = bash script-with-many-arguments.sh
    {first_argument}
    {second_argument}
    {third_argument}
Capture raw output
CrossCompute parses but does not save raw output from the script, unless requested to do so explicitly.
show_raw_output = True
Specify default values for arguments
When executed without arguments, crosscompute run uses the default values specified in the configuration file, which can save time during development.
x = 10
y = 3
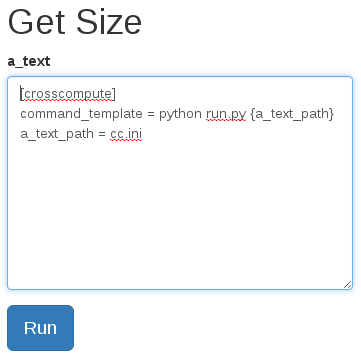
Additionally, crosscompute serve uses the default values to populate the tool form. If an argument name ends with _path and a default file path is specified, the web app will show the contents of the file in the form. For example, this configuration file
[crosscompute]
command_template = python run.py {a_text_path}
a_text_path = cc.ini
will render the following form.
Run tool
First, check that the application development framework is installed on your system.
$ crosscompute
usage: crosscompute {serve,run} ...
crosscompute: error: too few arguments
Then execute crosscompute run in the parent folder or same folder as your configuration file.
$ crosscompute run
[tool_location]
configuration_path = ~/Projects/crosscompute-docs/examples/python/divide-floats/cc.ini
tool_name = divide-floats

[result_arguments]
x = 10
y = 3

[raw_output]
10 divided by 3 is 3.3333333333333335

[result_properties]
raw_output = 10 divided by 3 is 3.3333333333333335
execution_time_in_seconds = 0.04039597511291504
command_path = ~/.crosscompute/divide-floats/results/2/x.sh
If there is more than one tool, you will need to specify the tool name explicitly.
$ crosscompute run divide-floats
Override default values
Sometimes, you might want to override default argument values. Use --help to show the required syntax.
$ crosscompute run --help
usage: divide-floats [-h] [--x X] [--y Y]

optional arguments:
-h, --help  show this help message and exit
--x X
--y Y
If our script terminates unexpectedly, crosscompute run will show the errors. In this case, the exception renders twice because show_raw_output = True.
$ crosscompute run --y 0
[tool_location]
configuration_path = ~/Projects/crosscompute-docs/examples/python/divide-floats/cc.ini
tool_name = divide-floats

[result_arguments]
x = 10
y = 0

[raw_output]
Traceback (most recent call last):
  File "run.py", line 4, in <module>
    print('{} divided by {} is {}'.format(x, y, float(x) / float(y)))
ZeroDivisionError: float division by zero

[result_properties]
return_code = 1
raw_output =
  Traceback (most recent call last):
    File "run.py", line 4, in <module>
      print('{} divided by {} is {}'.format(x, y, float(x) / float(y)))
  ZeroDivisionError: float division by zero
execution_time_in_seconds = 0.14070677757263184
command_path = ~/.crosscompute/divide-floats/results/4/x.sh
Serve tool
Once you are satisfied that the script is configured properly, execute crosscompute serve to serve the web app.
$ crosscompute serve
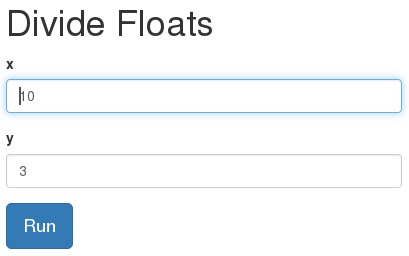
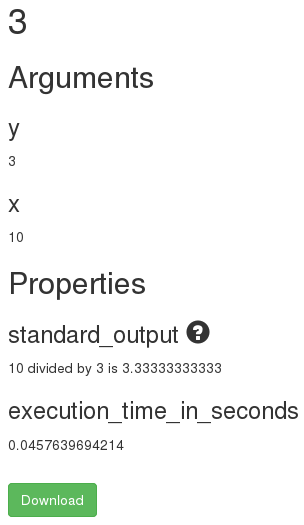
Click Run to see the result.
Start from a scaffold
To save time, you can start building your tool from a pre-defined scaffold, courtesy of Pyramid.
$ pcreate -l
Available scaffolds:
  alchemy:                 Pyramid SQLAlchemy project using url dispatch
  cc-python:               CrossCompute Tool in Python
  ir-posts:                InvisibleRoads Posts
  pyramid_jinja2_starter:  Pyramid Jinja2 starter project
  starter:                 Pyramid starter project
  zodb:                    Pyramid ZODB project using traversal
The cc-python scaffold will clone the basic tool scaffold in Python.
$ pcreate -s cc-python your-tool-name
Here is the basic tool scaffold configuration file.
[crosscompute]
command_template = python run.py
    --target_folder {target_folder}
Here is the basic tool scaffold script.
from argparse import ArgumentParser
from invisibleroads_macros.disk import make_enumerated_folder_for, make_folder
from invisibleroads_macros.log import format_summary


def run(target_folder):
    return []


if __name__ == '__main__':
    argument_parser = ArgumentParser()
    argument_parser.add_argument(
        '--target_folder',
        metavar='FOLDER', type=make_folder)

    args = argument_parser.parse_args()
    d = run(
        args.target_folder or make_enumerated_folder_for(__file__))
    print(format_summary(d))
Save output files
The target_folder argument is a special keyword that specifies the folder where your script can save files for the user to download.
[crosscompute]
command_template = python run.py {target_folder}
If your script saves files in the folder, then the user will have access to those files by downloading the archive on the result page.
from os.path import join
from sys import argv

target_file = open(join(argv[1], 'xyz.txt'), 'w')
target_file.write('Repeatedly try to start productive tasks')
Run the script by typing crosscompute run in the same folder as cc.ini.
$ crosscompute run
[tool_definition]
tool_name = save-text
configuration_path = ~/Experiments/save-text/cc.ini
command = python run.py /tmp/save-text/results/1

[result_arguments]
target_folder = /tmp/save-text/results/1

[result_properties]
execution_time_in_seconds = 0.0495231151581

$ ls /tmp/save-text/results/1
result.cfg  xyz.txt
Serve the script by typing crosscompute serve in the same folder as cc.ini.
$ crosscompute serve
Run the tool, then click Download to receive an archive containing the result configuration as well as any files saved in the target_folder.
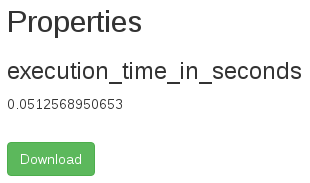
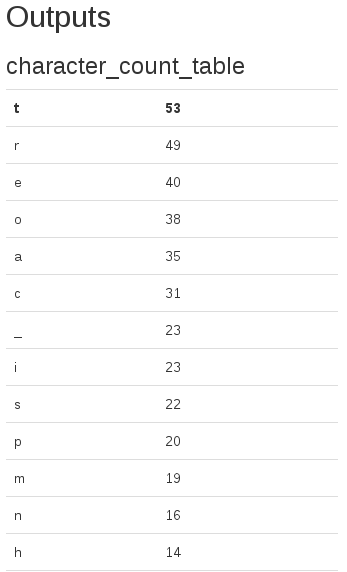
Additionally, the tool will be able to render the content of those files for selected data types (see Specify data types for result properties). Here is a slightly more involved example that counts the number of each non-whitespace character in a text file.
[crosscompute]
command_template = python run.py {target_folder} {source_text_path}

source_text_path = cc.ini
The script tells CrossCompute to render the output file as a table by printing a statement in the form xyz_table_path = abc.csv.
import csv
from collections import Counter
from invisibleroads_macros.disk import make_folder
from invisibleroads_macros.text import compact_whitespace
from os.path import join
from sys import argv

target_folder, text_path = argv[1:]
character_counter = Counter(compact_whitespace(open(text_path).read()))
del character_counter[' ']
target_path = join(make_folder(target_folder), 'character_count.csv')
csv_writer = csv.writer(open(target_path, 'w'))
csv_writer.writerows(character_counter.most_common())
print('character_count_table_path = ' + target_path)
Running the tool using crosscompute serve renders the desired table.
Specify data types for tool arguments
Specifying the data type of a tool argument provides the following benefits.
The script can assume that an argument matches its specified data type. For example, the script below can assume that its first argument is an integer because the framework performs basic integer validation before running the script.
The corresponding web application renders an appropriate query for the tool argument in the form.
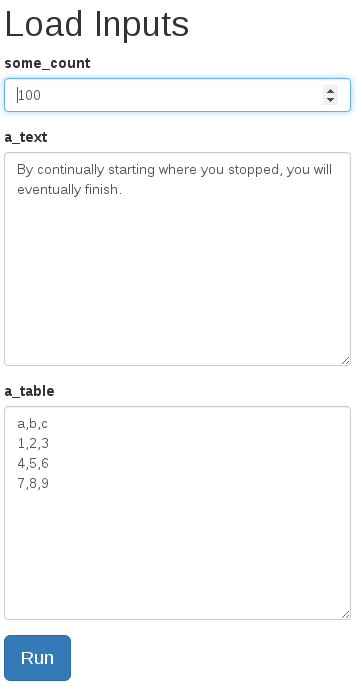
The suffix of a tool argument determines its data type. Specify tool arguments in the command_template by enclosing argument names in curly brackets (see Specify command-line arguments). In the configuration file below, the arguments are some_count (integer), a_text_path (text), a_table_path (table).
[crosscompute]
command_template = python run.py
    {some_count}
    {a_text_path}
    {a_table_path}

some_count = 100
a_text_path = abc.txt
a_table_path = xyz.csv
Only the configuration file command_template is relevant when determining tool argument data types. The script does not have to use the same argument names.
from csv import DictReader
from sys import argv

x, text_path, table_path = argv[1:]
print('x = %s' % x)
print('text = %s' % open(text_path).read().strip())
print('table.columns = %s' % DictReader(open(table_path)).fieldnames)
Install the relevant data type plugins. CrossCompute matches argument name endings to suffixes registered by installed data types.
pip install -U crosscompute-integer
pip install -U crosscompute-text
pip install -U crosscompute-table
You can also register your own data type plugins. For examples on how to write data type plugins, please see https://github.com/crosscompute/crosscompute-types.
Specify data types for result properties
Specifying the data type of a result property provides the following benefits.
The corresponding web application renders an appropriate value for the result property in the form.
First, include a target_folder in the command_template.
[crosscompute]
command_template = python run.py {target_folder}
Then, save output files in the target_folder (see Save output files) and print statements to standard output in the form abc_suffix = xyz where the suffix corresponds to the desired data type.
import matplotlib
matplotlib.use('Agg')  # Prevent no $DISPLAY environment variable warning

from invisibleroads_macros.disk import make_folder
from matplotlib import pyplot as plt
from os.path import join
from sys import argv

target_folder = make_folder(argv[1])
# Render integer
print('an_integer = 100')
# Render table
target_path = join(target_folder, 'a.csv')
open(target_path, 'w').write("""\
a,b,c
1,2,3
4,5,6
7,8,9""")
print('a_table_path = ' + target_path)
# Render image
target_path = join(target_folder, 'a.png')
figure = plt.figure()
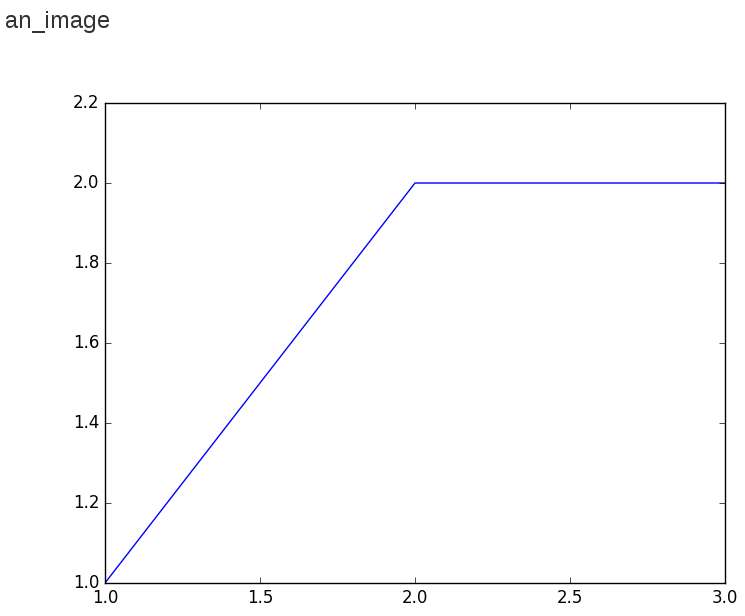
plt.plot([1, 2, 3], [1, 2, 2])
figure.savefig(target_path)
print('an_image_path = ' + target_path)
# Render geotable (map)
target_path = join(target_folder, 'b.csv')
open(target_path, 'w').write("""\
Latitude,Longitude,Description
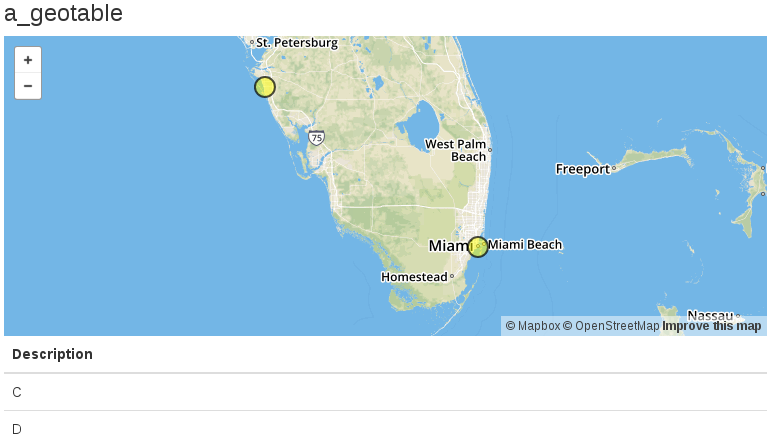
27.3364347,-82.5306527,A
27.3364347,-82.5306527,B
25.7616798,-80.1917902,C
25.7616798,-80.1917902,D
""")
print('a_geotable_path = ' + target_path)
The example above contains the following print statements:
print('an_integer = ...')       # Render integer
print('a_table_path = ...')     # Render table
print('an_image_path = ...')    # Render image
print('a_geotable_path = ...')  # Render geoimage (map)
Serve and run the tool to render the result.
$ crosscompute serve

Log errors and warnings
There are two ways that you can communicate an error or warning to the user:
Option 1: Set
show_raw_output = Truein the configuration file (see Capture raw output). The advantage is that this does not require changes in the script.Option 2: Print to standard output in the format
abc.error = xyz. The advantage is that this provides finer control of the information that you share with the user.
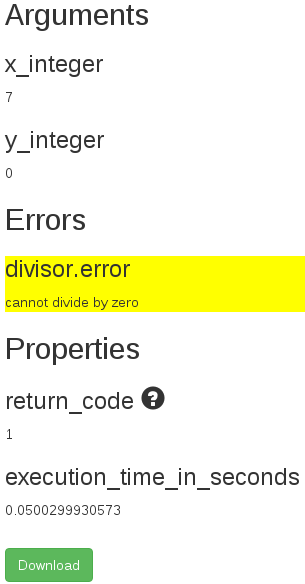
[crosscompute]
command_template = python run.py {x_integer} {y_integer}

x_integer = 7
y_integer = 3
from sys import argv

x, y = map(int, argv[1:])
try:
    print('quotient = {}'.format(x / y))
    print('remainder = {}'.format(x % y))
except ZeroDivisionError:
    exit('divisor.error = cannot divide by zero')
Specify help popovers
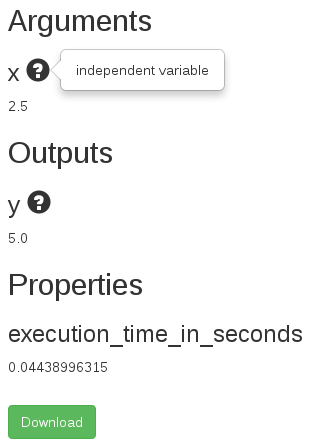
A help popover is a helpful description that appears when the user touches a question mark icon. To add a help popover to a tool argument or result property, use the following syntax in the configuration file:
your_argument_name.help = helpful description
your_result_property.help = another description
Here is an example configuration file.
[crosscompute]
command_template = python run.py {x}

x.help = independent variable
y.help = dependent variable
And here is the resulting interface.
Add descriptions
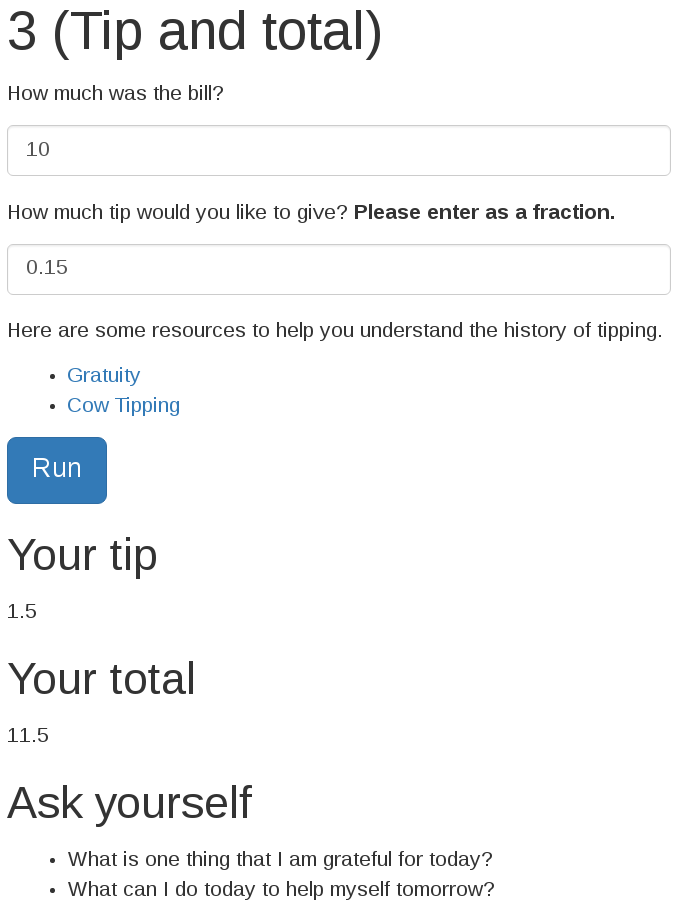
For longer descriptions and links, you can customize your tool and result interface in Markdown format.
[crosscompute]
command_template = python run.py {amount} {fraction}

amount = 10
fraction = 0.15
fraction.help = Enter a fraction

tool_template_path = tool.md
result_template_path = result.md
Here is the tool template.
# Calculate Tip

{amount: How much was the bill?}

{fraction: How much tip would you like to give?}
Here is the result template.
# Calculated Tip

{tip}

{total}
And here is the resulting interface.
Serve multiple tools
There are two ways to organize your files when serving multiple tools:
Option 1: Have multiple configuration files in separate folders and launch
crosscompute servefrom the parent folder.. ├── count-characters │ ├── cc.ini │ └── run.py └── divide-floats ├── cc.ini └── run.py
Option 2: Have a single configuration file with multiple sections.
[crosscompute add-numbers]
command_template = python add_numbers.py {a} {b}

[crosscompute subtract-numbers]
command_template = python subtract_numbers.py {a} {b}
Call an external API
If your script requires an API key because it calls an external API, please specify the API key as an environment variable in your script.
from os import environ
environ['GOOGLE_KEY']
The following APIs are supported:
GOOGLE_KEY
MAPBOX_TOKEN
Show tables
First, make sure you have installed the appropriate data type plugin.
pip install -U crosscompute-table
Then, save the table in target_folder.
from os.path import join
target_path = join(target_folder, 'points.csv')
csv_writer = csv.writer(open(target_path, 'w'))
csv_writer.writerow(['x', 'y'])
csv_writer.writerow([100, 100])
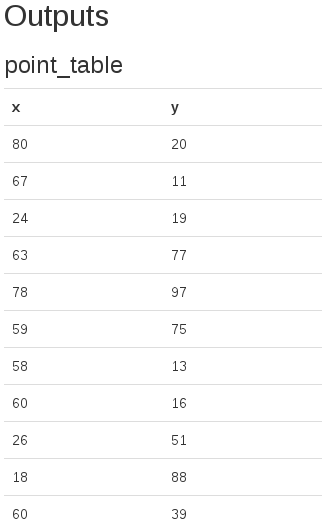
Finally, print the table path to standard output, making sure to specify the data type suffix.
print('point_table_path = ' + target_path)
Here is an example configuration file.
[crosscompute]
command_template = python run.py
    --target_folder {target_folder}
    --point_count {point_count}
    --x_min {x_min}
    --x_max {x_max}
    --y_min {y_min}
    --y_max {y_max}

point_count = 100
x_min = 0
x_max = 100
y_min = 0
y_max = 100
Here is an example script.
import csv
from argparse import ArgumentParser
from invisibleroads_macros.disk import make_enumerated_folder_for, make_folder
from invisibleroads_macros.log import format_summary
from os.path import join
from random import randint


def run(target_folder, point_count, x_min, x_max, y_min, y_max):
    target_path = join(target_folder, 'points.csv')
    csv_writer = csv.writer(open(target_path, 'w'))
    csv_writer.writerow(['x', 'y'])
    for index in range(point_count):
        x = randint(x_min, x_max)
        y = randint(y_min, y_max)
        csv_writer.writerow([x, y])
    return [
        ('point_table_path', target_path),
    ]


if __name__ == '__main__':
    argument_parser = ArgumentParser()
    argument_parser.add_argument(
        '--target_folder',
        metavar='FOLDER', type=make_folder)

    argument_parser.add_argument(
        '--point_count',
        metavar='COUNT', type=int, required=True)
    argument_parser.add_argument(
        '--x_min',
        metavar='FOLDER', type=int, required=True)
    argument_parser.add_argument(
        '--x_max',
        metavar='FOLDER', type=int, required=True)
    argument_parser.add_argument(
        '--y_min',
        metavar='FOLDER', type=int, required=True)
    argument_parser.add_argument(
        '--y_max',
        metavar='FOLDER', type=int, required=True)

    args = argument_parser.parse_args()
    d = run(
        args.target_folder or make_enumerated_folder_for(__file__),
        args.point_count,
        args.x_min,
        args.x_max,
        args.y_min,
        args.y_max)
    print(format_summary(d))
$ crosscompute serve make-points
Show images
First, make sure you have installed the appropriate data type plugin.
pip install -U crosscompute-image
Then, save the image in target_folder. If you are using matplotlib to generate the image, then ensure that the script will run without a display by specifying the Agg backend.
import matplotlib
matplotlib.use('Agg')

from matplotlib import pyplot as plt
from os.path import join

target_path = join(target_folder, 'points.png')
figure = plt.figure()
# Generate your plot here
figure.savefig(target_path)
Finally, print the image path to standard output, making sure to specify the data type suffix.
print('point_image_path = ' + target_path)
Here is an example configuration file.
[crosscompute]
command_template = python run.py
    --target_folder {target_folder}
    --point_table_path {point_table_path}
    --point_table_x_column {point_table_x_column}
    --point_table_y_column {point_table_y_column}

point_table_path = points.csv
point_table_x_column = x
point_table_y_column = y
Here is an example script.
import matplotlib
matplotlib.use('Agg')

from argparse import ArgumentParser
from crosscompute_table import TableType
from invisibleroads_macros.disk import make_enumerated_folder_for, make_folder
from invisibleroads_macros.log import format_summary
from matplotlib import pyplot as plt
from os.path import join


def run(
        target_folder,
        point_table,
        point_table_x_column,
        point_table_y_column):
    xys = point_table[[point_table_x_column, point_table_y_column]].values
    figure = plt.figure()
    plt.scatter(xys[:, 0], xys[:, 1])
    image_path = join(target_folder, 'points.png')
    figure.savefig(image_path)
    return [
        ('points_image_path', image_path),
    ]


if __name__ == '__main__':
    argument_parser = ArgumentParser()
    argument_parser.add_argument(
        '--target_folder',
        metavar='FOLDER', type=make_folder)

    argument_parser.add_argument(
        '--point_table_path',
        metavar='PATH', required=True)
    argument_parser.add_argument(
        '--point_table_x_column',
        metavar='COLUMN', required=True)
    argument_parser.add_argument(
        '--point_table_y_column',
        metavar='COLUMN', required=True)

    args = argument_parser.parse_args()
    d = run(
        args.target_folder or make_enumerated_folder_for(__file__),
        TableType.load(args.point_table_path),
        args.point_table_x_column,
        args.point_table_y_column)
    print(format_summary(d))
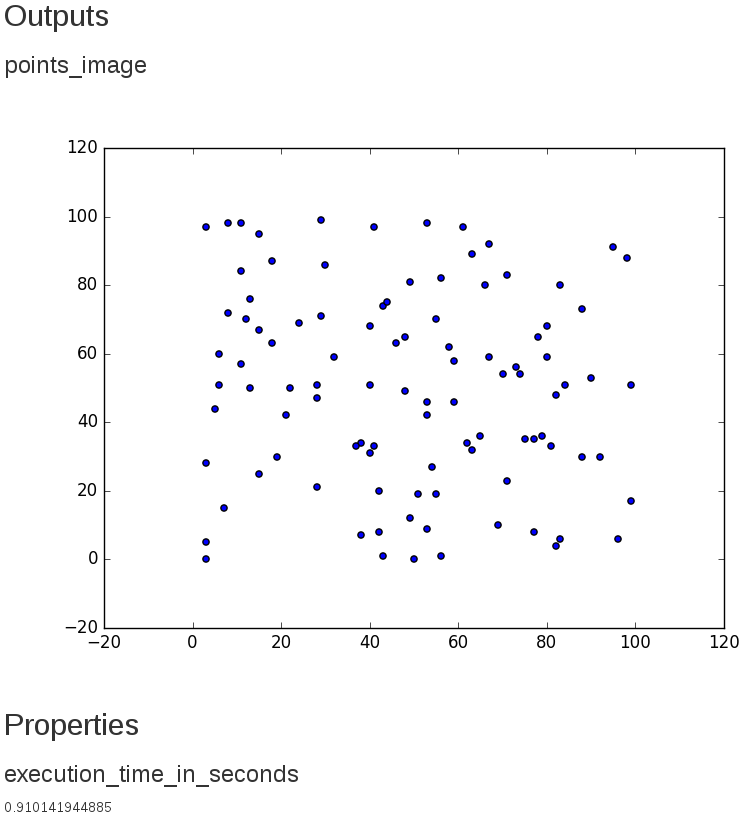
$ crosscompute serve show-plot
Show maps
The geotable data type uses the table name and column names to render the map (see Render geometries).
First, make sure you have installed the appropriate data type plugin.
pip install -U crosscompute-geotable
Then, save a table with spatial coordinates in target_folder. If you are using pandas, then you can use to_csv, to_json, to_msgpack to save in CSV, JSON, MSGPACK format, respectively.
from pandas import DataFrame
target_path = join(target_folder, 'memory.csv')
memory_table = DataFrame([
    ('Todos Santos', 15.50437, -91.603653),
    ('Semuc Champey', 15.783471, -90.230759),
], columns=['Description', 'Latitude', 'Longitude'])
map_table.to_csv(target_path, index=False)
Finally, print the table path to standard output, making sure to specify the data type suffix.
print('memory_table_path = ' + target_path)
Here is an example configuration file.
[crosscompute show-map]
command_template = python show_map.py
    --target_folder {target_folder}
    --map_table_name {map_table_name}
    --map_table_path {map_table_path}

map_table_name = location_pencil_geotable
map_table_path = locations.csv
Here is an example script. Please save it as show_map.py.
from argparse import ArgumentParser
from crosscompute_table import TableType
from invisibleroads_macros.disk import make_enumerated_folder_for, make_folder
from invisibleroads_macros.log import format_summary
from os.path import join


def run(target_folder, map_table_name, map_table):
    target_path = join(target_folder, 'map.csv')
    map_table.to_csv(target_path, index=False)
    return [(map_table_name + '_path', target_path)]


if __name__ == '__main__':
    argument_parser = ArgumentParser()
    argument_parser.add_argument(
        '--target_folder',
        metavar='FOLDER', type=make_folder)

    argument_parser.add_argument(
        '--map_table_name',
        metavar='NAME', required=True)
    argument_parser.add_argument(
        '--map_table_path',
        metavar='PATH')

    args = argument_parser.parse_args()
    d = run(
        args.target_folder or make_enumerated_folder_for(__file__),
        args.map_table_name,
        TableType.load(args.map_table_path))
    print(format_summary(d))
Here is an example table that specifies feature radius and color. Please save it as locations.csv.
ID,Description,Latitude,Longitude,RadiusInPixelsRange10-20FromMean,FillBluesFromSum
A,"Bar Harbor, ME",44.3876119,-68.2039123,3,1
B,"New York, NY",40.7127837,-74.0059413,1,1
C,"New York, NY",40.7127837,-74.0059413,1,1
D,"New York, NY",40.7127837,-74.0059413,1,1
E,"Sarasota, FL",27.3364347,-82.53065269999999,1,1
F,"Sarasota, FL",27.3364347,-82.53065269999999,3,1
$ crosscompute serve show-map
$ crosscompute serve show-map-examples
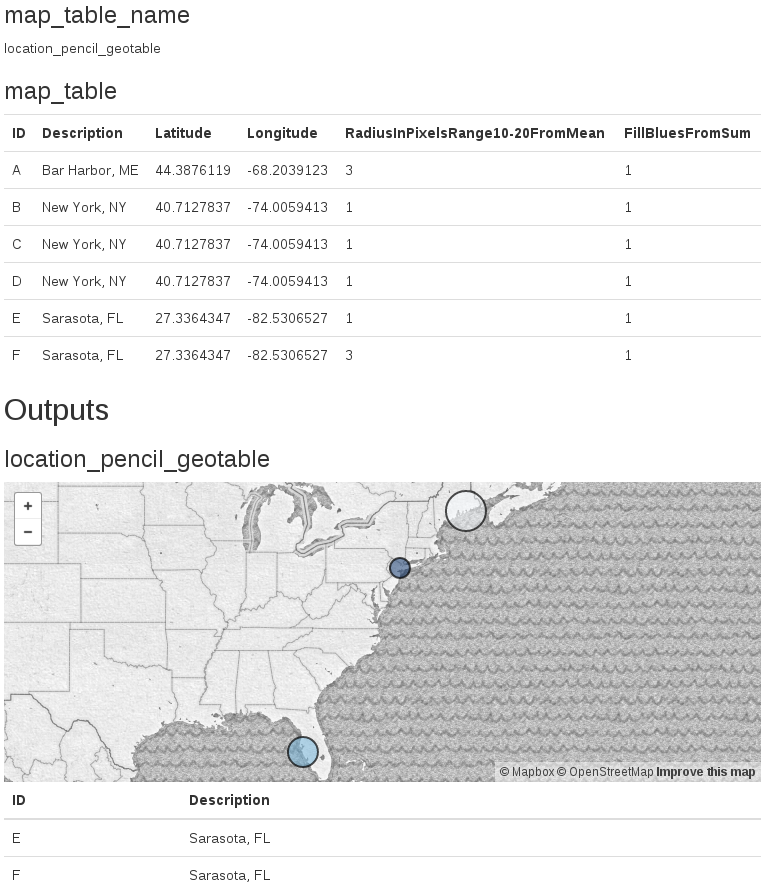
Note that clicking on a feature in the map will show its attributes in a table.
Render geometries
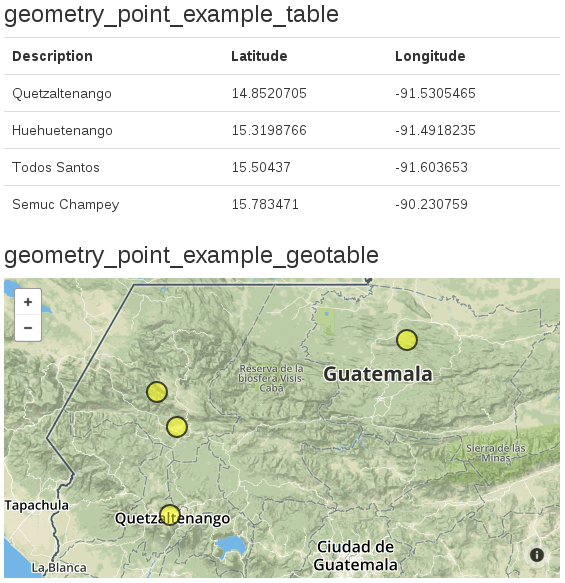
If the table has a column name ending in _latitude and a column name ending in _longitude, then each row will render as a point in the map.
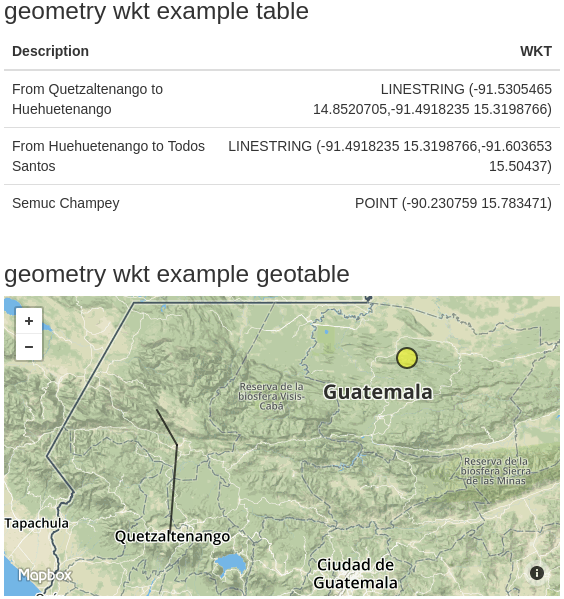
If the table has a column name ending in _wkt, then each row will render as the corresponding WKT geometry. Specify WKT coordinates using (longitude, latitude) coordinate order.
Here are the recognized WKT geometry types:
POINT
MULTIPOINT
LINESTRING
MULTILINESTRING
POLYGON
MULTIPOLYGON
Vary background
To change the map background, specify the desired tile layer in the table name.
a_streets_satellite_geotable
an_outdoors_geotable
a_pirates_geotable
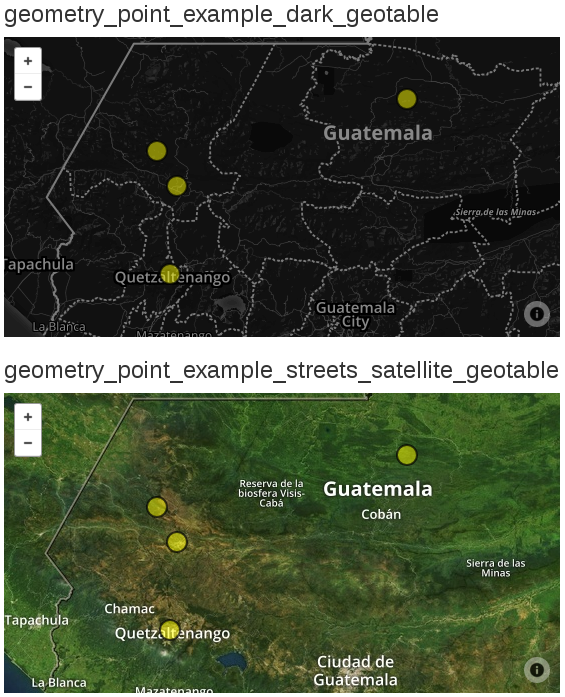
Here are the available backgrounds, courtesy of Mapbox:
streets
light
dark
satellite
streets-satellite
wheatpaste
streets-basic
comic
outdoors
run-bike-hike
pencil
pirates
emerald
high-contrast
Specify radius
If the table has a column that starts with RadiusInMeters or radius_in_meters or radius-in-meters or radius in meters or some variation thereof and if the row is a point geometry, then the value for the row in that column will render as the point radius in meters. Use this setting if it is important to visualize the real-world radius of each point.
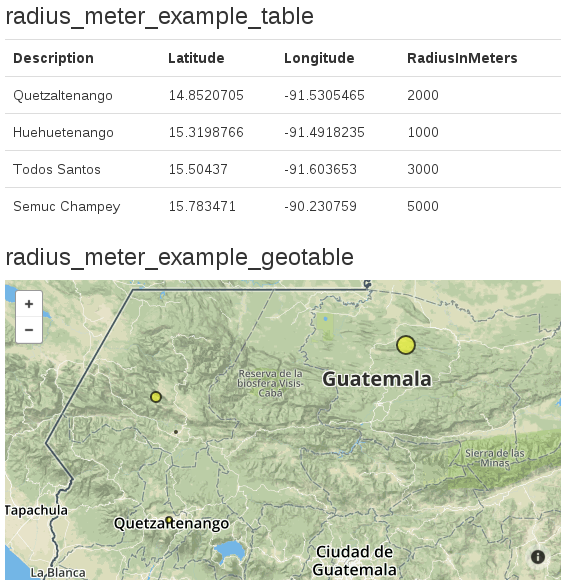
If the table has a column that starts with RadiusInPixels, radius_in_pixels, radius-in-pixels or radius in pixels and if the row is a point geometry, then the value for the row in that column will render as the point radius in pixels. This setting ensures that the point will remain the same size on the screen independent of the map zoom level.
Sometimes it can be convenient to scale the radius to a specific range. Use the syntax RadiusInPixelsRange10-100, radius_in_pixels_range_10_100, radius-in-pixels-range-10-100 or radius in pixels range 10 100.
If there are multiple rows for a given geometry, then you can specify how to combine the values to compute the radius.
RadiusInPixelsFromMean
RadiusInPixelsRange10-100FromMean
RadiusInPixelsFromSum
RadiusInPixelsRange10-100FromSum
Specify fill color
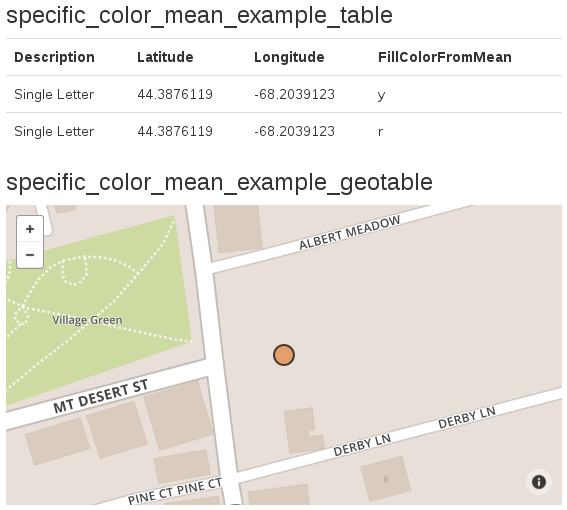
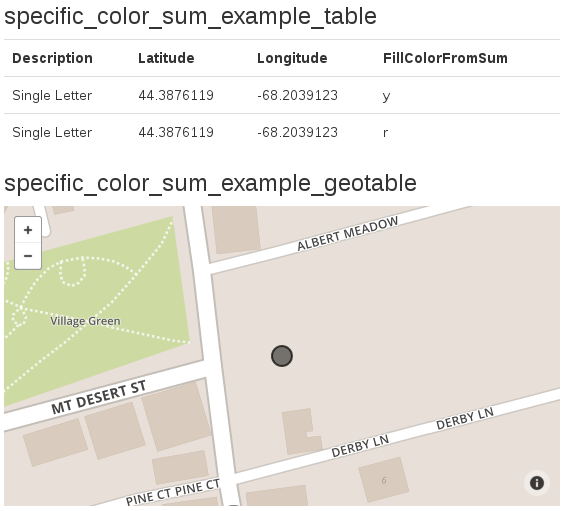
Add a column named FillColor to specify the fill color of the geometry, courtesy of the Matplotlib color module. Here are examples of valid values in the FillColor column.
# b blue, g green, r red, c cyan, m magenta, y yellow, k black, w white
r

# gray shade specified as decimal between 0 and 1
0.1

# hex string
#ff565f

# color name
purple
If there are multiple rows for a given geometry, then you can specify how to combine the values to compute the fill color.
FillColorFromMean
FillColorFromSum
Use color scheme
If the column name starts with Fill, followed by the name of a recognized color scheme, then the geometry will normalize and render the value for the row in that column to the specified color scheme.
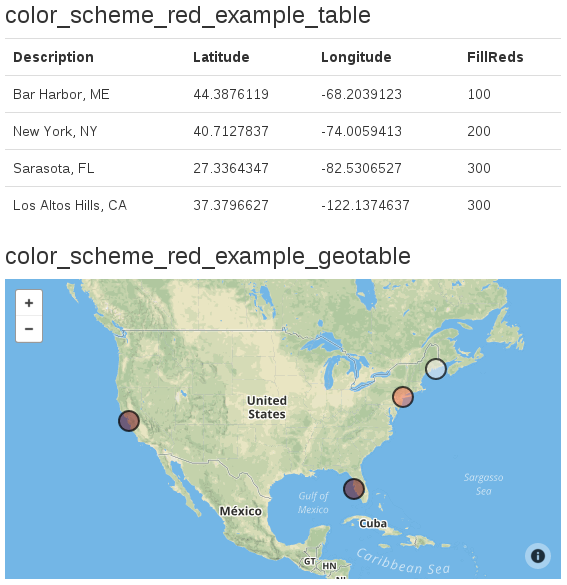
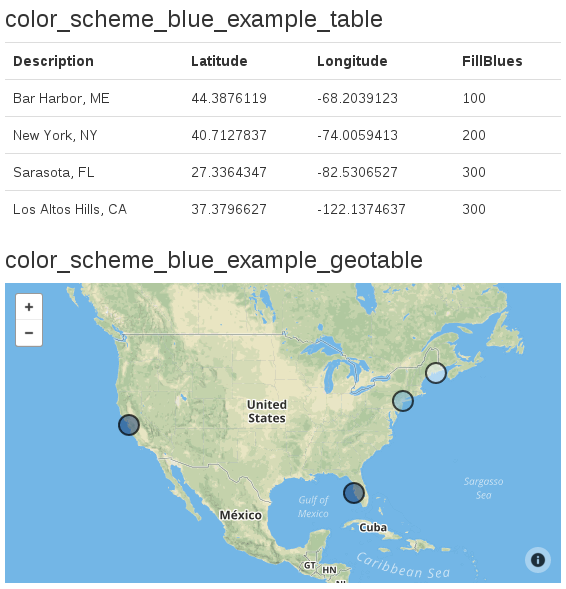
Here are the recognized color schemes, courtesy of ColorBrewer:
blues
brbg
bugn
bupu
gnbu
greens
greys
oranges
orrd
paired
pastel1
piyg
prgn
pubu
pubugn
puor
purd
purples
rdbu
rdgy
rdpu
rdylbu
rdylgn
reds
set1
set3
spectral
ylgn
ylgnbu
ylorbr
ylorrd
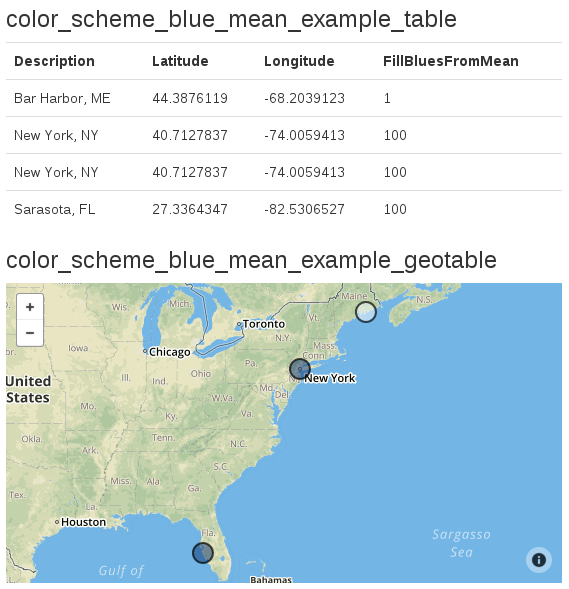
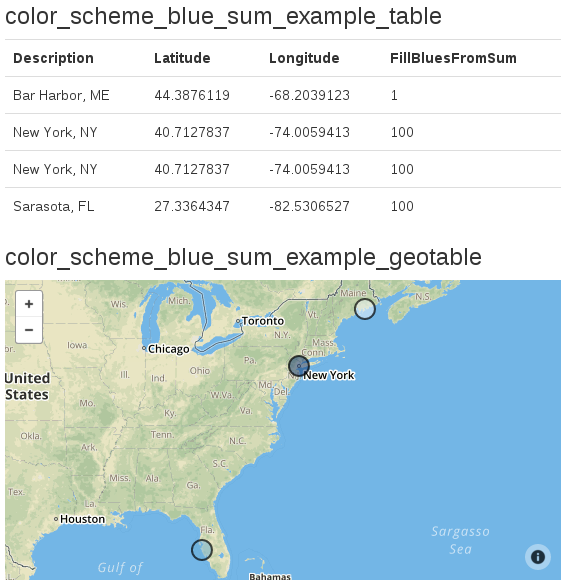
If there are multiple rows for a given geometry, then you can specify how to combine the values to compute the fill color.
FillBluesFromMean
FillBluesFromSum
Deploy geotable-based tool locally
If you are deploying your geotable-based tool on a local server, then you can take advantage of higher API rate limits for map tiles by specifying a Mapbox access token.
Set the MAPBOX_TOKEN environment variable before running the server. Here is the syntax in Linux:
$ export MAPBOX_TOKEN=YOUR-ACCESS-TOKEN
$ crosscompute serve